Analysis of 2.5 Million Boston Taxi
Trips
Introduction
Boston’s
Department of Transportation released a detailed dataset covering 2.5 million
individual taxi trips in the city from May through November 2012. After some
analysis, I found that the data is more than just a vast list of taxi pickup
and drop-off coordinates: it tells the story of Boston. Which locations are
“hotspots” for taxi activity? On average, what time are taxis most active? The
dataset answers these questions and more.
Small
Multiple Map by Month
The official taxi-trip
record dataset contains data for over 2.5 million taxi trips from May through
June 2015. Each individual trip record contains precise location coordinates
for where the trip started and ended and timestamps for when the trip started and
ended. At first, I extracted all of the data using QGIS to map the coordinates
of every trip. However, once I plotted all of the points, I could not make any
sense of the data because the culmination of all the data points was too dense
to analyze. Consequently, after some research, I decided to use the heatmap tool available on QGIS to create a data
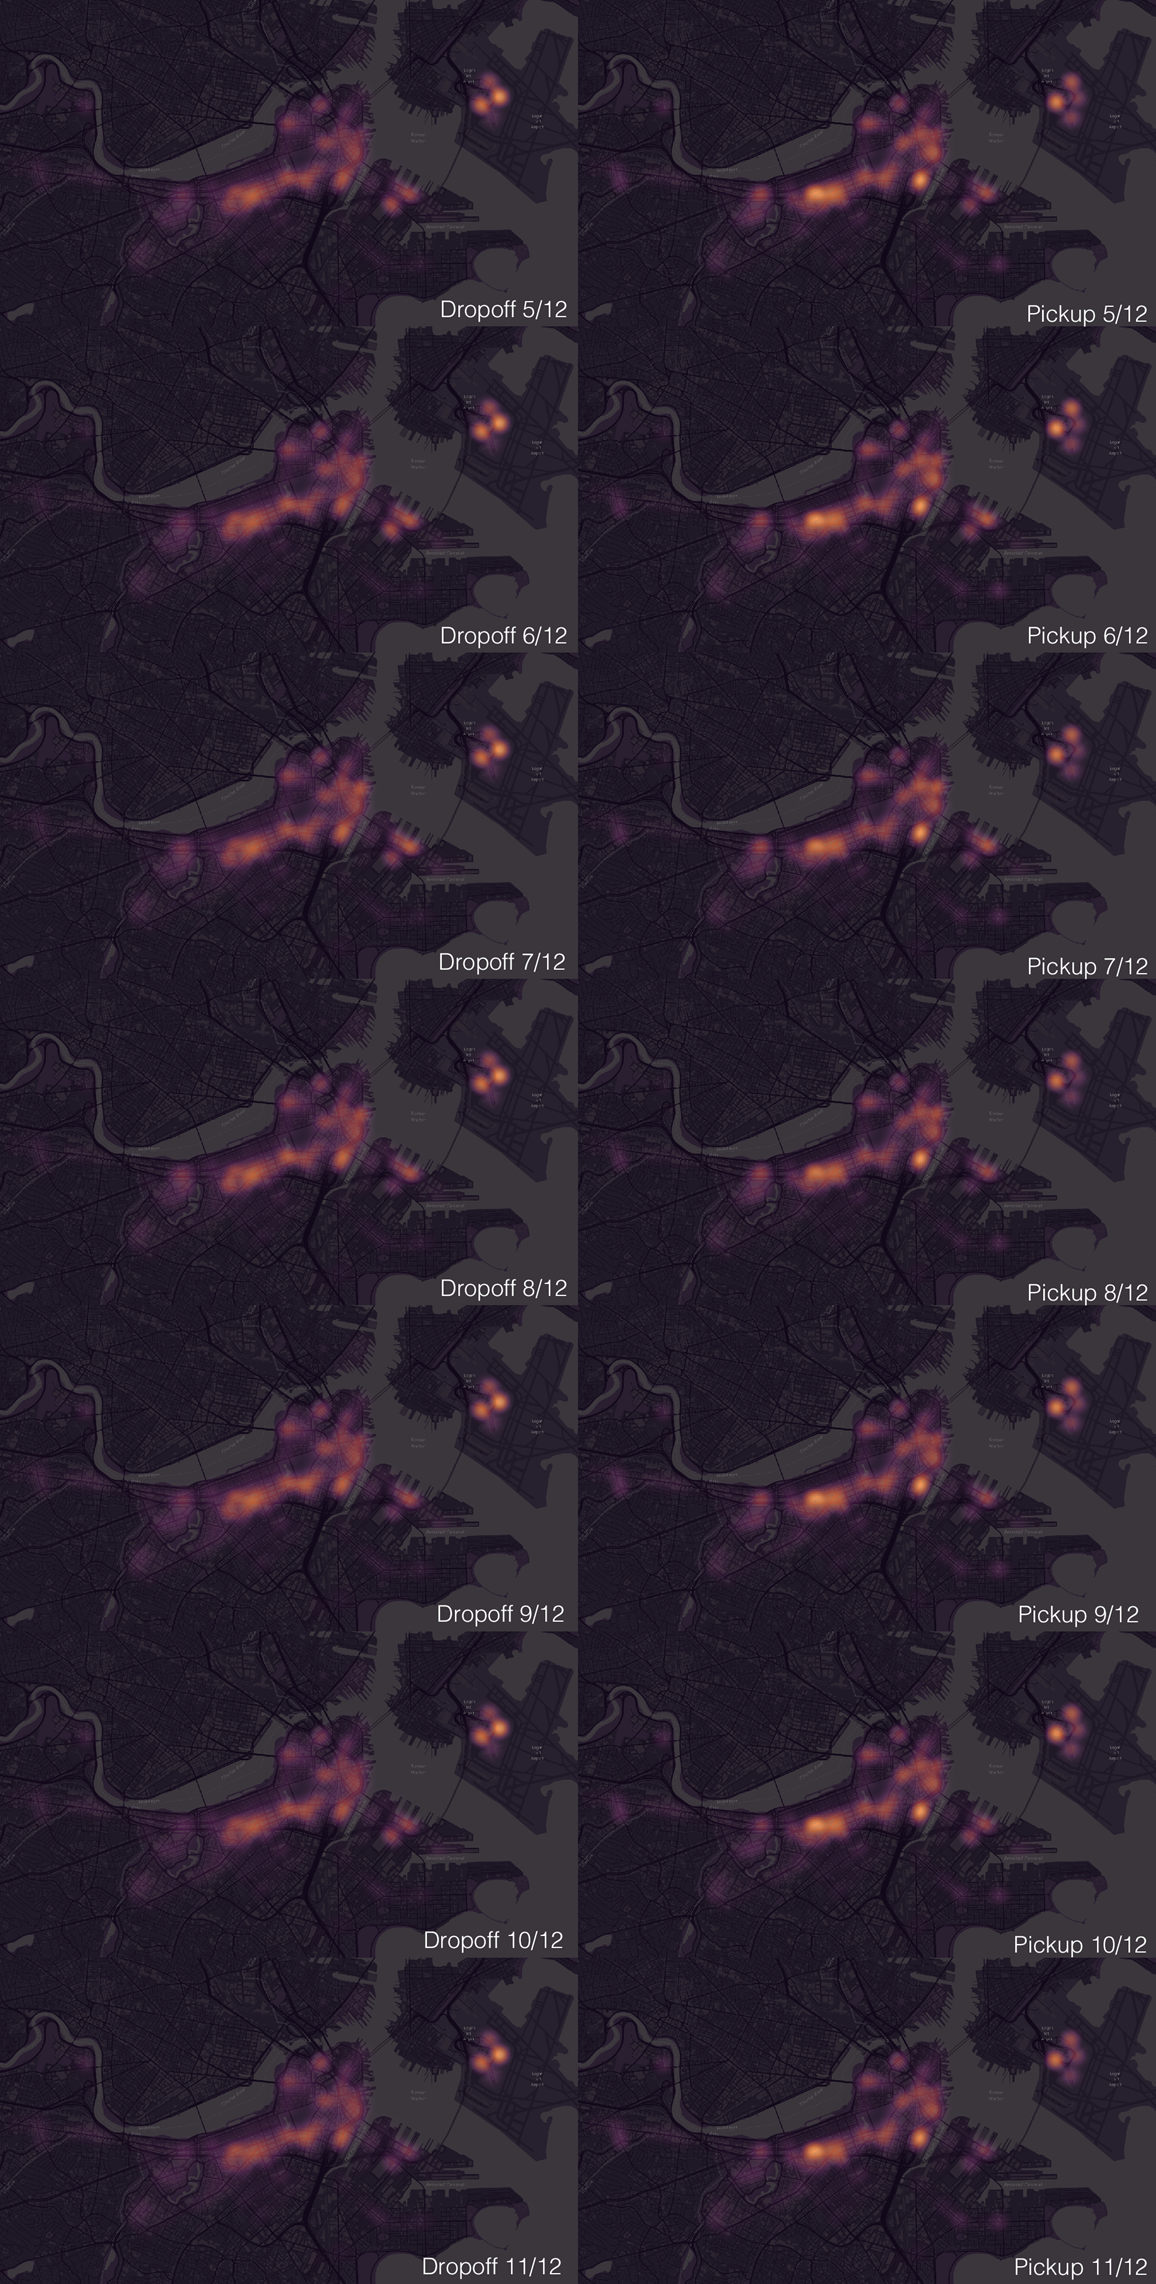
visualization where I can see “hotspots.” Finally, I used Adobe Photoshop to
create a small multiple of the data for each month, where the maps on the left
represent the drop-offs and the maps on the right represent the pickups.
I decided to use
this color scheme and create a small multiple map to display this data after
reading Tufte’s ideas: I decided to choose yellow for
the heatmap and dark grey for the background map to
clearly differentiate each layer from each other, effectively allowing viewers
to form relationships between the heatmap and the
actual map of Boston. Similarly, I decided to create my data visualizations
using small multiples because this technique allows viewers to enforce
“comparisons of change,” as the information slices are positioned “within the
eye span.”
After creating the
small multiple map by month, I found that hotspots for taxi drop-offs from 5/12
to 11/12 were almost identical; similarly, I discovered that hotspots for taxi
pickups within the same time frame were also almost indistinguishable. Thus,
from the small multiple that I created, I concluded that taxi activity on
average remains the same between each month, at least between May through
November.
However, the data
does not support circumstances where snow may play a factor in taxi drop-off
and pickup locations, as I am missing data from December to April. Similarly,
with data from only 2012 and none from other years, I cannot be sure that my
small multiple can accurately model future taxi activities. Thus, in order to
ensure that my findings are reliable, future research should include all months
throughout a year and data from multiple years.
After comparing
the drop-off maps to the pickup maps, I also found that hotspots were easier to
identify on the pickups maps compared to the drop-off maps, as there were more
areas on the pickup maps that were bright yellow. Although I found this
offsetting at first, I came to the conclusion that taxi drop-offs should be
more dispersed than taxi pick-ups because the destination of a trip could vary
from the passenger’s house, the cemetery, to the Boston Public Library.
However, a taxi pick-up would be more condensed because the pick-up location
for taxis is not only dependent on the location of the passengers, but also the
location of the taxis themselves. While drop-off locations are based on
people’s destinations, pickups are dependent on both the passengers and taxis’
location, all of which forces taxi pickup locations to be more close to each
other.
I also found that
for both drop-off and pickup maps, the most popular hotspots include Hynes
Convention Center, Wilbur Theater, Majestic Theater, and South Station. With
all of the restaurants, bars, and entertainment surrounding the Hynes
Convention Center, this result does make sense. To analyze the data in more
detail, however, I decided to create a small multiple map based on time
intervals.
Small
Multiple Map by Time
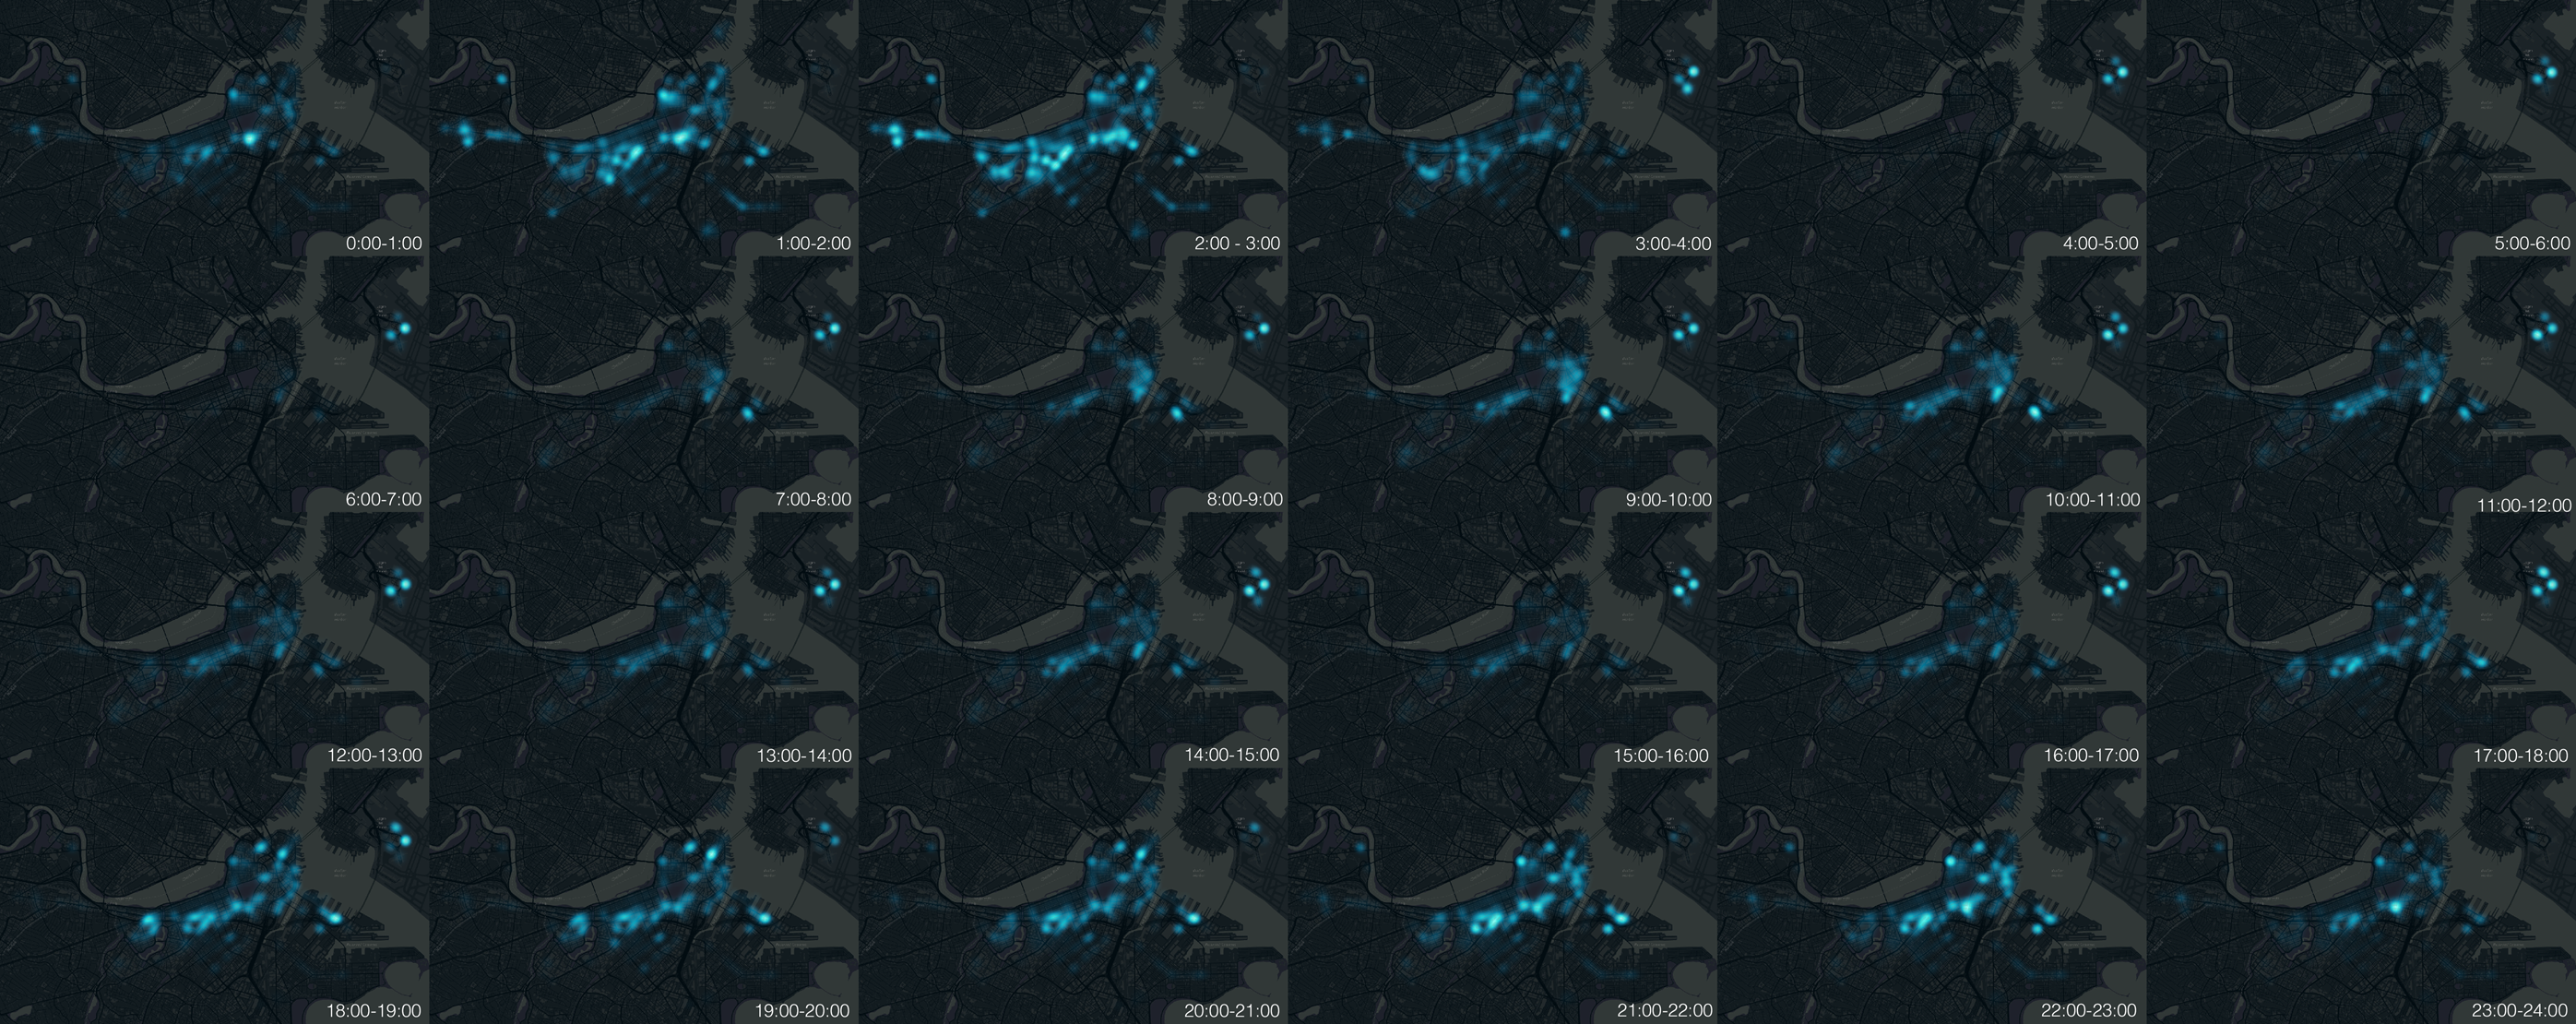
The small
multiple displays taxi pickup and drop-off locations based on different time
intervals. Between midnight and 1am, I found that most people were getting
dropped off around Stuart Street. Given
that the area provides a lot of nightlife entertainment and restaurants – for
example, the Bijou Nightclub, the Wang Theatre, and Genki
Ya – this makes sense. Between 1-4am, taxi activity seems to have increased
significantly; after further analysis, however, popular drop-off locations are
still similar to ones before midnight with slight variances: bars, liquor
stores, and hotels. As such, if a person were in need of a cab, I would
recommend that person walk towards the nearest pub or bar as those locations
are where taxi drivers are most active during that time.
Furthermore,
I found that taxi activity was nearly nonexistent between 4-7am. This makes
sense because nightlife usually ends around 4am, so the number of people
needing transportation during that time interval should die down. Additionally,
between 7-11am, the area with the most taxi activity is Summer Street outside
of the Boston Convocation and Exhibition Center. There should be a lot of taxi
activity there because the Boston Convention and Exhibition Center is located near
the South Boston waterfront, Boston’s World Trade Center, and across the harbor
from Logan International Airport. Around that area is also near the MBTA Silver
Line, which has direct connections to South Boston and Logan Airport, making it
a central transportation point. From 4pm till midnight, areas around Seaport
Blvd also becomes extremely popular. With the number of restaurants around that
street – for example, Del Frisco’s Legal Test Kitchen, Temazcal
Tequila Cantina, and Legal Harborside – combined with
the view of sea, the increase in taxi activity during that time frame is not
surprising.
What is
most surprising about the small multiple map, however, is that taxi activity
seems to be most active during the night, but one would expect taxi activity to
be most active during the day because that is the time period when people
actually need to commute. One factor that could explain this phenomenon are
companies such as Uber and Lyft. Assuming that Uber and Lyft drivers are more
willing to work during the day, taxi activity may become diminished after 8pm
because people are more willing to pay for those services rather than a normal
cab. Assuming the same logic, people in need for transportation at night would
be forced to take a cab because of the decrease supply in Uber and Lyft
drivers, all of which creates more taxi activity at night. Furthermore, the
number of intoxicated people could also contribute to the increase in taxi
activity because people are more willing to take a cab as opposed to driving or
walking home due to safety. Not surprisingly though, Logan Airport consistently
has a lot of taxi activity regardless of the time, most likely due to erratic
flight schedules and the fact that Ubers and Lyfts
are banned around that area. To analyze the data in more detail, however, I
decided to create a small multiple bar graph based on what day it is.
Small
Multiple Bar Graph by Day
According to the
data, demand for taxis drop after 8pm on most weekdays and 1am on weekends. Furthermore, taxi activity significantly drops
between 3-5am for both weekend and weekdays, but gradually rises after that
time frame. Interestingly, this contradicts our previous conclusion that taxi
activity is low during the day compared to at night. This could be due to the
way QGIS creates heatmaps: the heatmap
simply shows how concentrated a location is, but it does not necessarily show the
number of coordinates there are in total. For example, if every single Taxi coordinate
were evenly distributed in Boston, even though there may be more taxi activity
overall, the heatmap will not be able to detect that.
Thus, our new data suggests that our previous conclusion is possibly wrong
because the drop-off location is more randomized during the day compared to
during the night. After some analysis, this does make sense because only bars,
nightclubs, and certain other venues are open late at night, while passengers
have the freedom during the day to visit other places such as the museum, the
theaters, or the library. Thus, the taxi activity may look weaker during the
day because the coordinates are more evenly distributed during that time frame.
Another
interesting trend to note is the gradual increase in taxi activity by day after
Sunday until Saturday night, where the taxi activity drops back to its
“initial” value. This was surprising because I anticipated the taxi activity
for each weekday to be similar: Why should taxi activity be greater on Tuesday
than on Monday? With our current data, we can only make conjectures without any
solid conclusion as to why this may happen, so future research is needed to
analyze other possible factors. Also, the usual peak between 7-10am no longer
exists during the weekend. This makes sense, because people no longer have an
incentive to wake up early during the weekend.
