Boston Traffic Visualization
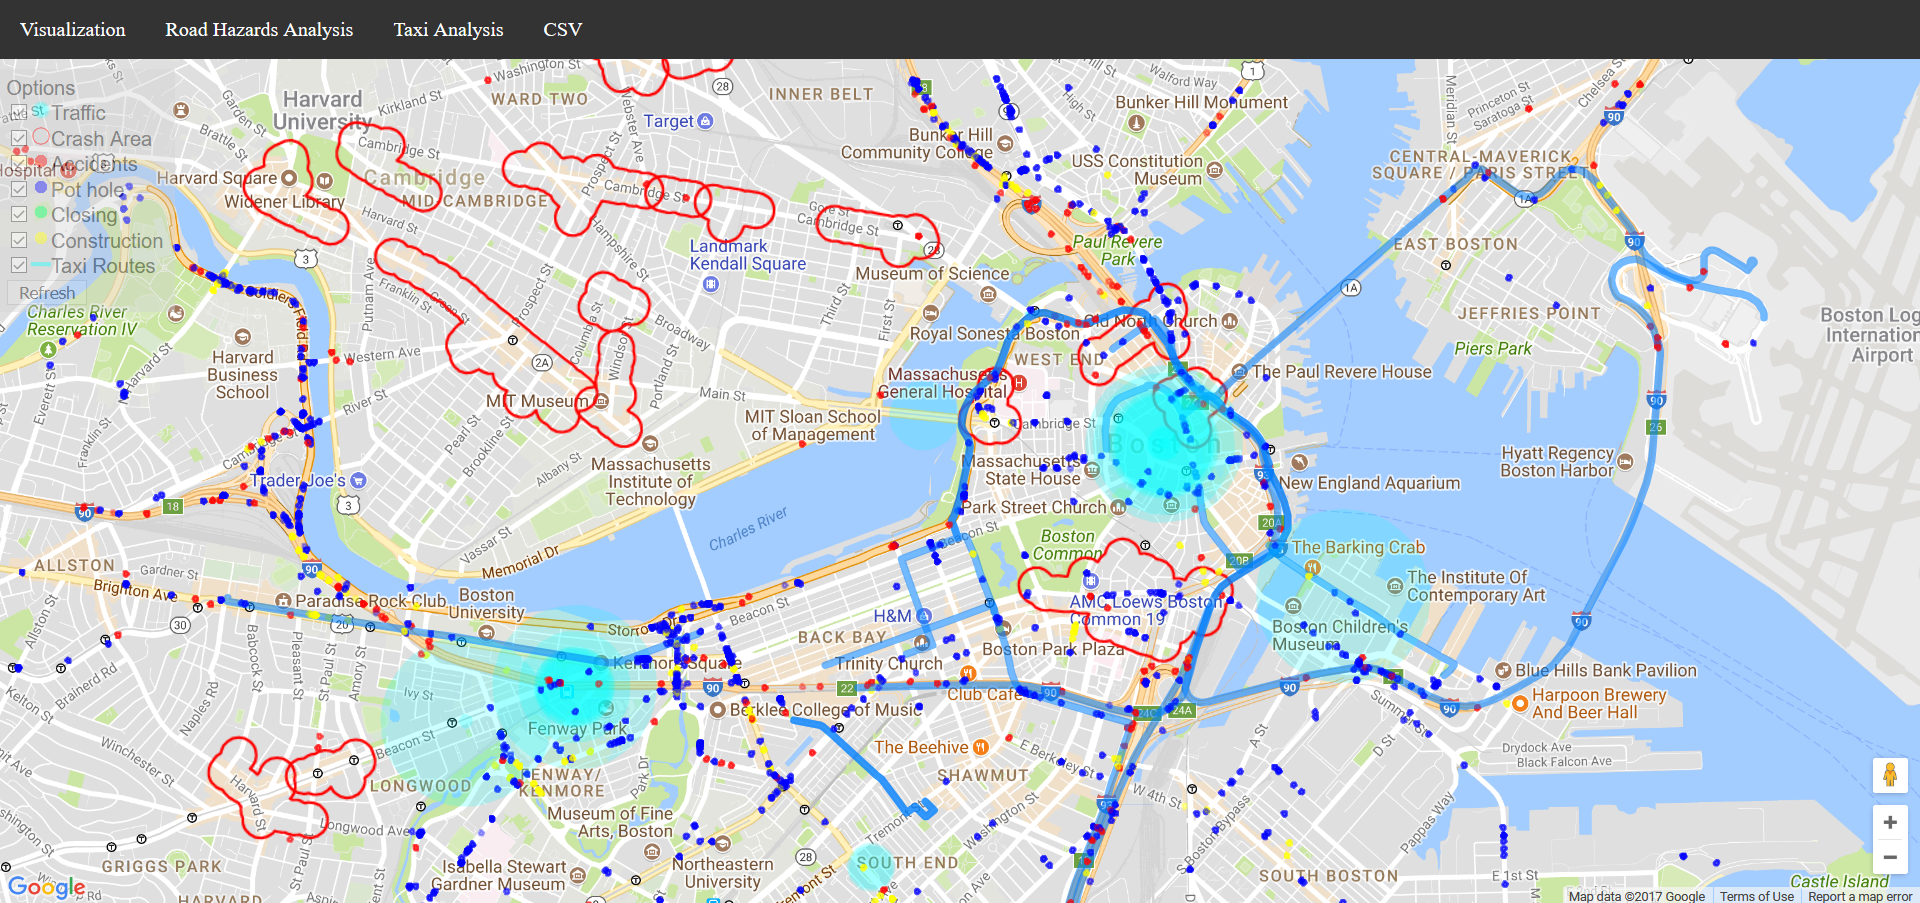
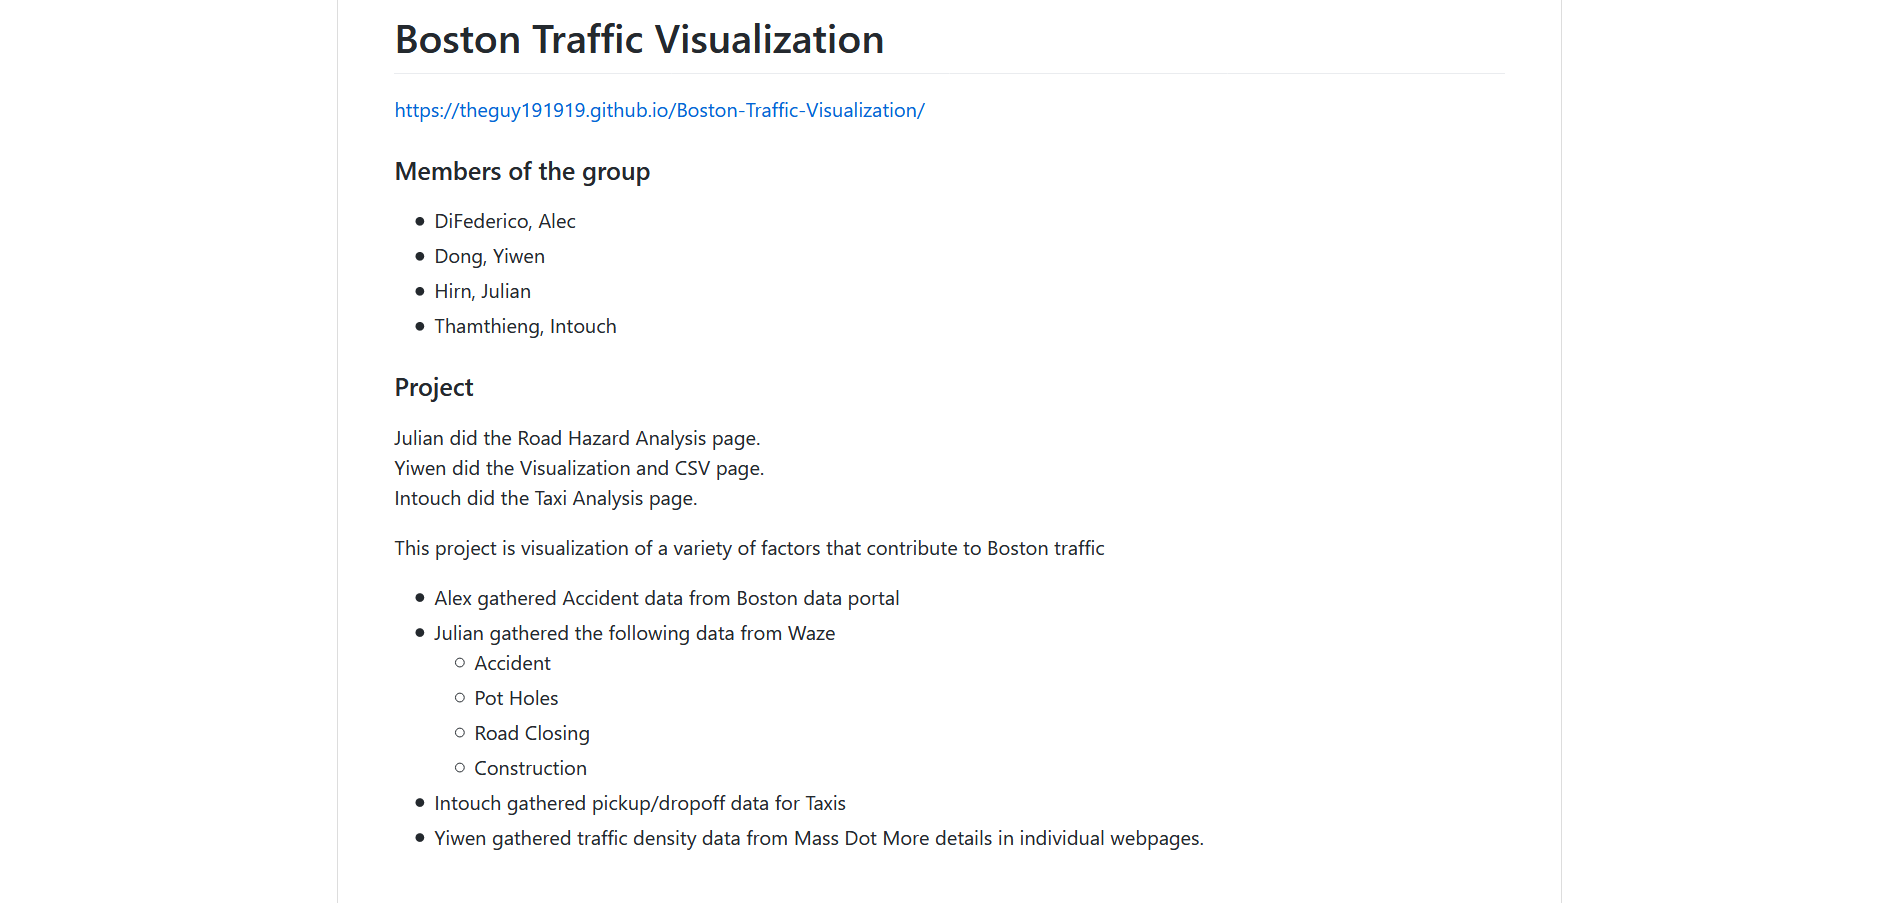
Collaborative project for a class to show the factors contributing to Boston congestion.
- Loads in thousands of datapoints from csv files.
- Uses Google maps api for accurate maping.
- Developed tools to scrape data into csv files from various gov websites.
Images


